Changelog

Follow new updates and improvements to Checkly.

What’s New in May: CLI 8, Private Location metrics, Maintenance Window improvements and Playwright Check Suite upgrades
May brought many big releases: CLI 8, faster Playwright Check Suites, Private Location metrics, safer alert channels and more flexible Maintenance Windows.

Here’s the roundup: big launches, small fixes, and the updates you and your favorite AI agent should probably know about too.


Checkly CLI 8: ESM-only, cancellable runs, and recording by default

CLI 8 ships three major changes:

  • ESM-only: requires Node.js versions matching ^20.19.0 || >=22.12.0

  • Cancellable Playwright Check Suite runs: CTRL+C now cancels test, pw-test, and trigger runs instead of burning quota in the background

  • Recording by default: test, pw-test, and trigger now record unless you pass -no-record

Want the run to keep going? Use detached mode:

npx checkly test -d 

Also included: bundled jiti, Playwright include patterns resolved from the config directory, and automatic .env loading.

Learn more in the Checkly CLI 8 announcement

# Don’t forget to upgrade 
npm install -D checkly@latest 

Playwright Check Suites: faster private location runs, full control

We shipped a batch of improvements to make Playwright Check Suites faster, more reliable, and easier to debug.

Highlights include:

  • Cancellable runs for queued and in-progress Check Suite runs

  • Custom runtime engines with Bun 1.7 and Node.js 22, 24, and 26

  • Automatic retries for setup steps affected by transient network or cache issues

  • Browser caching in Private Locations to avoid repeated Playwright browser downloads

  • Full Playwright globalTimeout support with timeout errors shown in logs and the Failures tab

  • Better trace processing logs for report generation, trace processing, and secret scrubbing

Private Location browser caching is available from Private Location agent version 8.2.0

👉🏼 Learn more in the Playwright Check Suites changelog update.


Private Location observability metrics are now in the UI, Prometheus

You can now see Private Location health and performance metrics directly in the Checkly UI, making it easier to understand how your agents are doing and whether your Private Location has enough capacity.
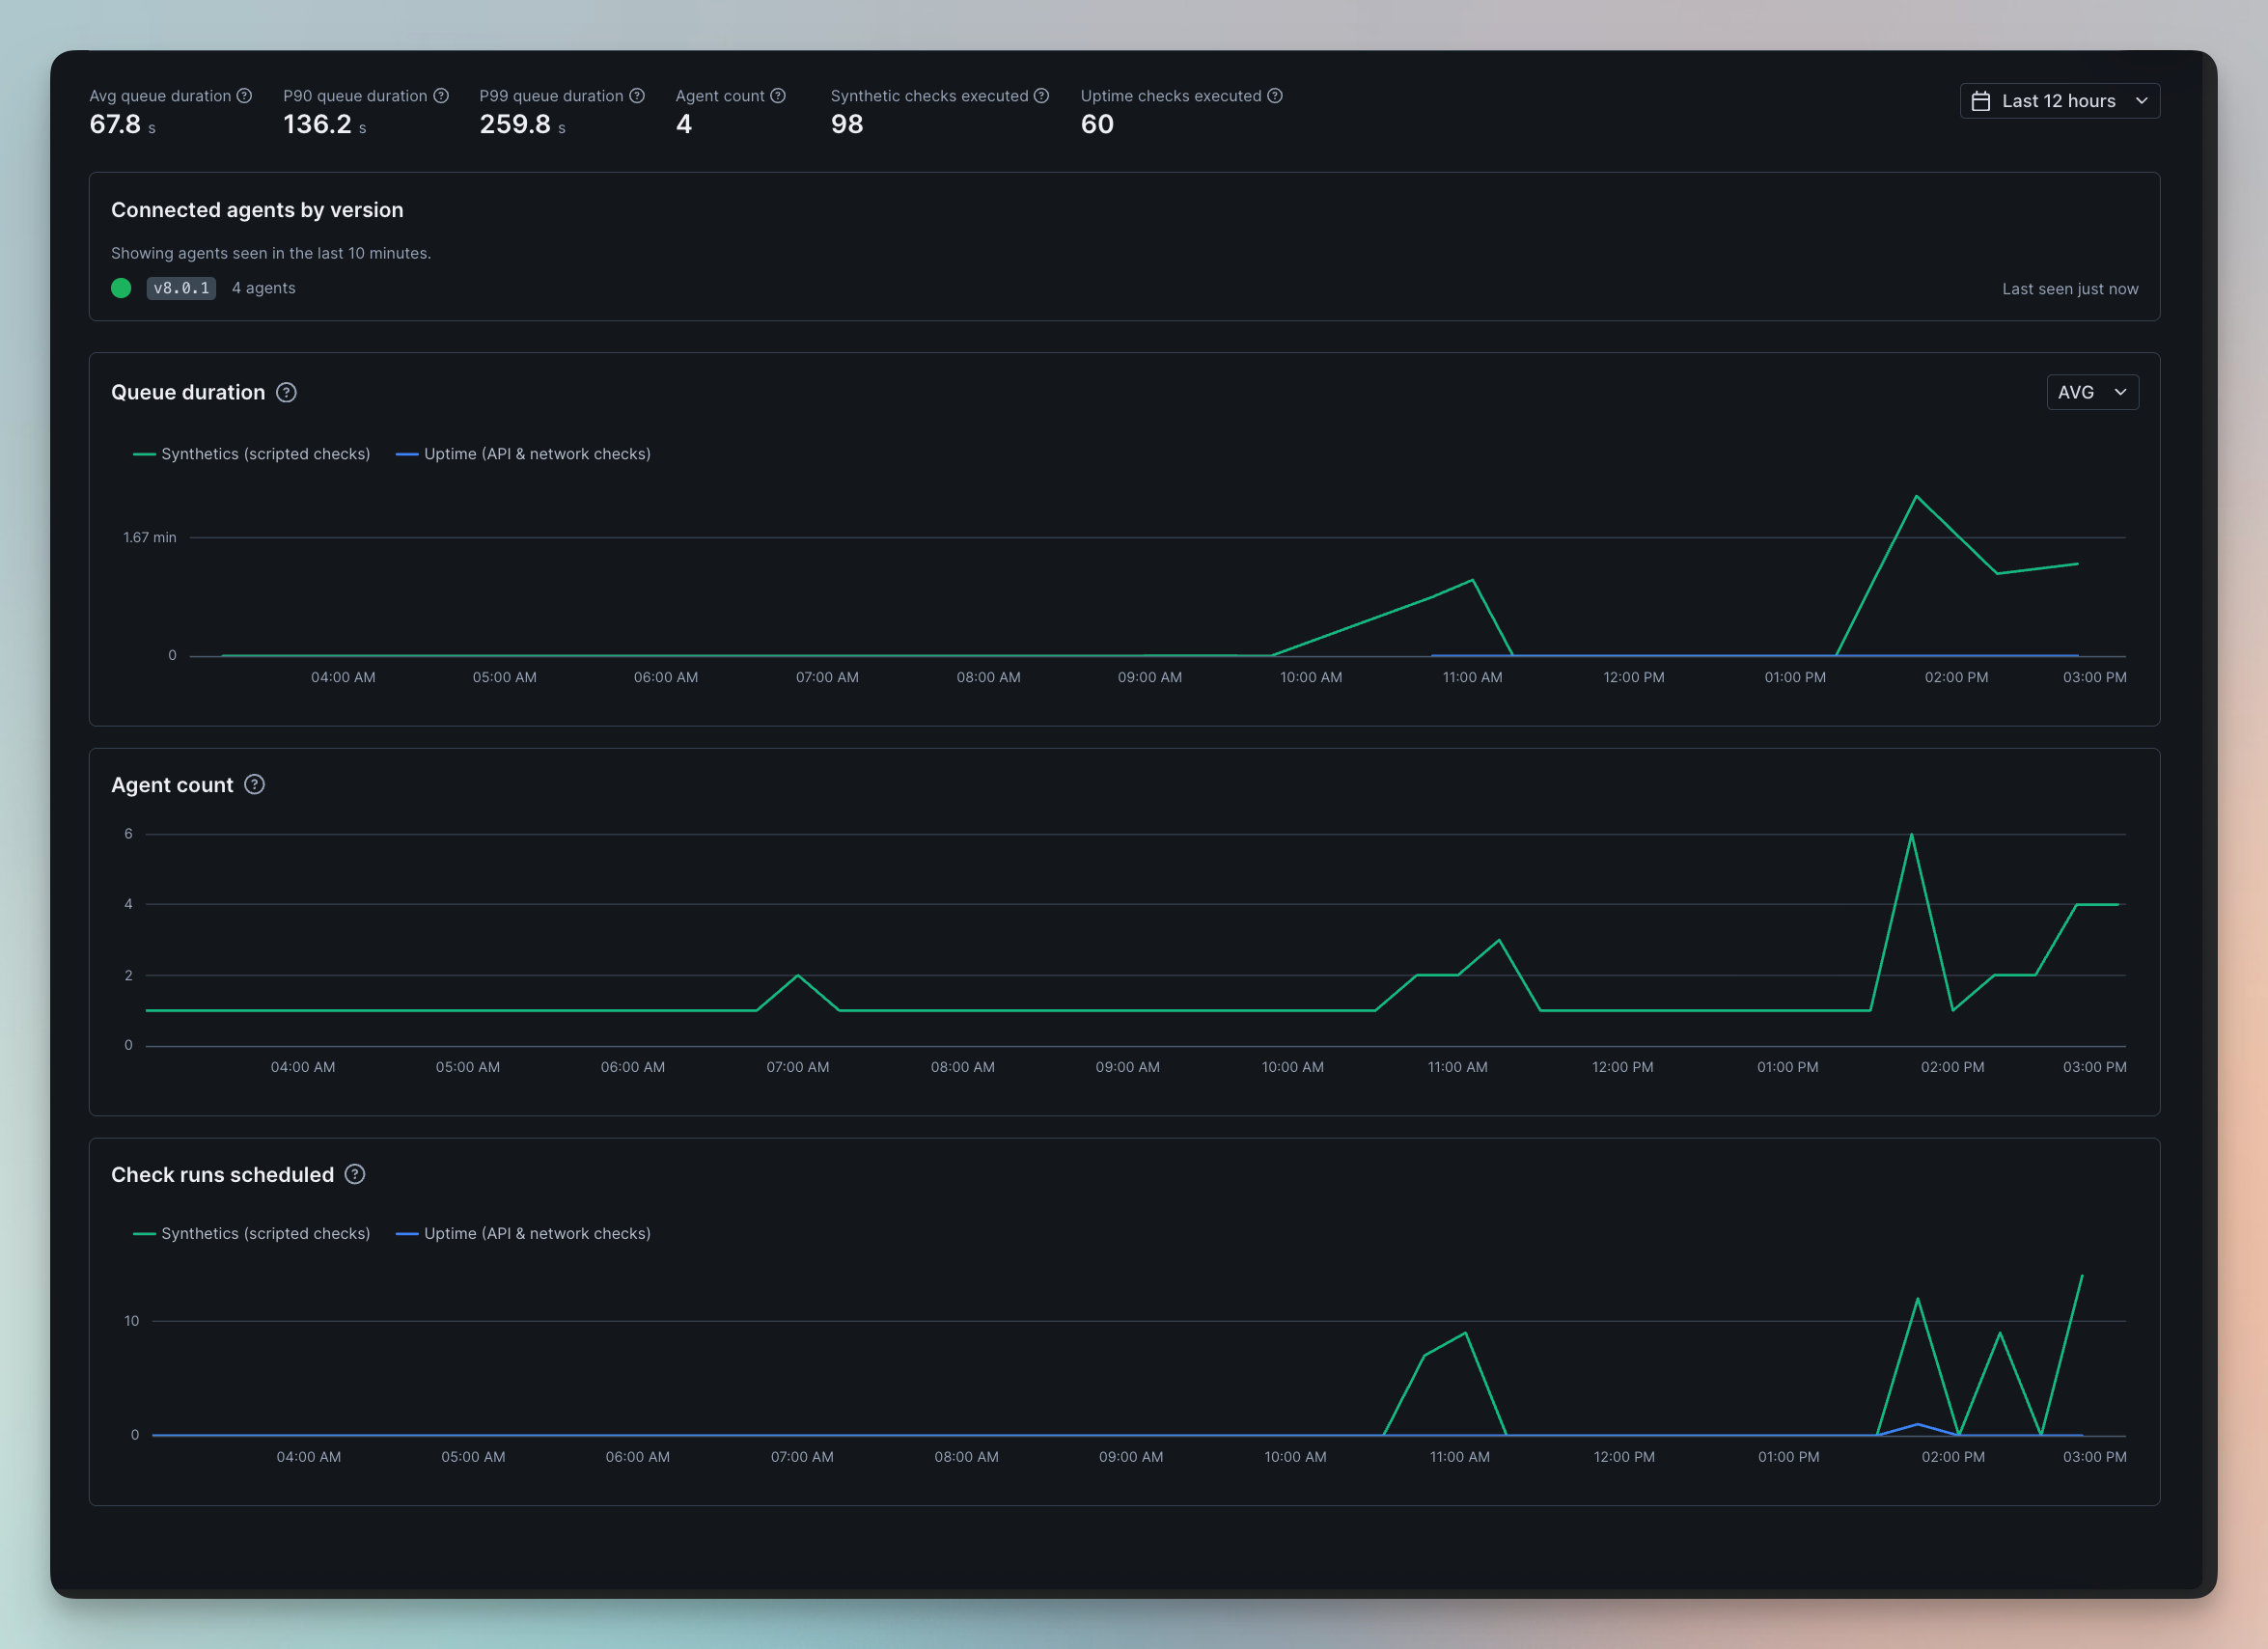
A Private Location reporting 4 agents connected, queue duration, agent count and check runs scheduled

The new metrics include:

  • Queue duration — how long checks wait before an agent picks them up

  • Agent count — how many agents are currently reporting

  • Scheduled check runs — how many check runs are scheduled for the Private Location

These metrics help you spot whether your Private Location agents are over- or underprovisioned. For example, if checks are spending too much time in the queue before they run, that’s a strong signal that your agents may need more capacity. No more guessing whether the queue is fine, spicy, or quietly on fire.

We also updated how Private Location status is shown in the UI. The previous green-dot indicator has been replaced with a clearer Reporting / Not Reporting state, with Last seen at shown alongside it. This makes agent health checks easier to read at a glance.

List with 2 Private Locations: one Reporting with 3 agents and one not reporting with 0 Agents

For teams running Private Location agents on Kubernetes, these metrics are also available through Prometheus V2. You can use them to autoscale Private Location capacity with KEDA, based on queued and in-flight check runs

The new Private Location Autoscaling Guide shows how to use the checkly_private_location_check_runs metric to scale agent pods up during traffic bursts and back down when demand drops. That helps prevent queue buildup without keeping idle capacity around just in case.


Alert channels now support environment secrets

Alert channels now support secrets with the double {{ secret here}} syntax, so sensitive values like API keys no longer need to live in plain text inside alert channel configs.

That means fewer secrets sitting around in the UI or API responses. Always a good day when plaintext secrets pack their little bags and leave.

You can also convert existing values into secrets by clicking the new lock icon in the alert channel configuration.


Maintenance Windows: pause checks, silence alerts, or both

Maintenance windows now give more granular control over what happens to checks during planned downtime. Instead of just pausing checks, two behaviors can be independently configured: Pause check execution

  • Scheduled check runs are skipped for the duration of the window

  • Scoped to all checks or specific checks by tag

  • Manual and triggered runs (UI, API trigger) always execute regardless [new behavior]

Silence alerts

  • Checks keep running and collecting data, but alert notifications (email, Slack, etc.) are suppressed

  • Scoped to all checks or specific checks by tag, can use different tags than the pause scope

  • New reminders are suppressed, existing reminders are paused and resume after the window ends

The home dashboard now shows a maintenance badge on affected check, group, and heartbeat rows with paused/silenced state, an updated banner summarizing active behaviors, and a new "Under maintenance" status filter.On the API side, maintenance window endpoints now accept pauseAllChecks, silenceAlertsTags, and silenceAllAlerts, in addition to the pre-existing tags.Existing maintenance windows continue to work as before. CLI, TF and Pulumi support isn't included and will require a follow-up.


API PSA: swagger.json is deprecated

The old API spec at:

<https://api.checklyhq.com/swagger.json> 

is now deprecated and frozen.

Please use the newer OpenAPI spec instead:

<https://api.checklyhq.com/openapi.json> 

The old swagger.json file will remain available for compatibility, but now includes a deprecation notice in the file description and response headers. Modern spec, fewer sharp edges.


Happy monitoring!

Questions or feedback?

Join our Slack community.

Monthly update

What’s New in April

Here’s a roundup of the new features and improvements we shipped over the past month.

Get started with the Checkly CLI using your agent

We’ve introduced a new command that helps you get started with Checkly from your terminal and integrates with your preferred agent:

# From ~/path/to/my-unmonitored-project/
npx checkly init

This sets up Checkly Skills, provides a prompt tailored to your project’s setup and one-shots your Checkly monitoring suite with Claude Code, Codex, Cursor… or any other agent of your choosing.

👉🏼 Learn more about the Checkly CLI and how to use it with your agent

Additional improvements:

  • checkly rca run and checkly rca get to run and view your Rocky AI Root Cause Analysis directly from your CLI - Docs

  • --preserve-resources for destroy to detach resources from a CLI project while keeping them in your account - Docs

👉🏼 Learn more in the changelog update: Agent-friendly Checkly CLI

# Don't forget to upgrade!

npm i -D checkly@latest
pnpm i -D checkly@latest
yarn add -D checkly@latest

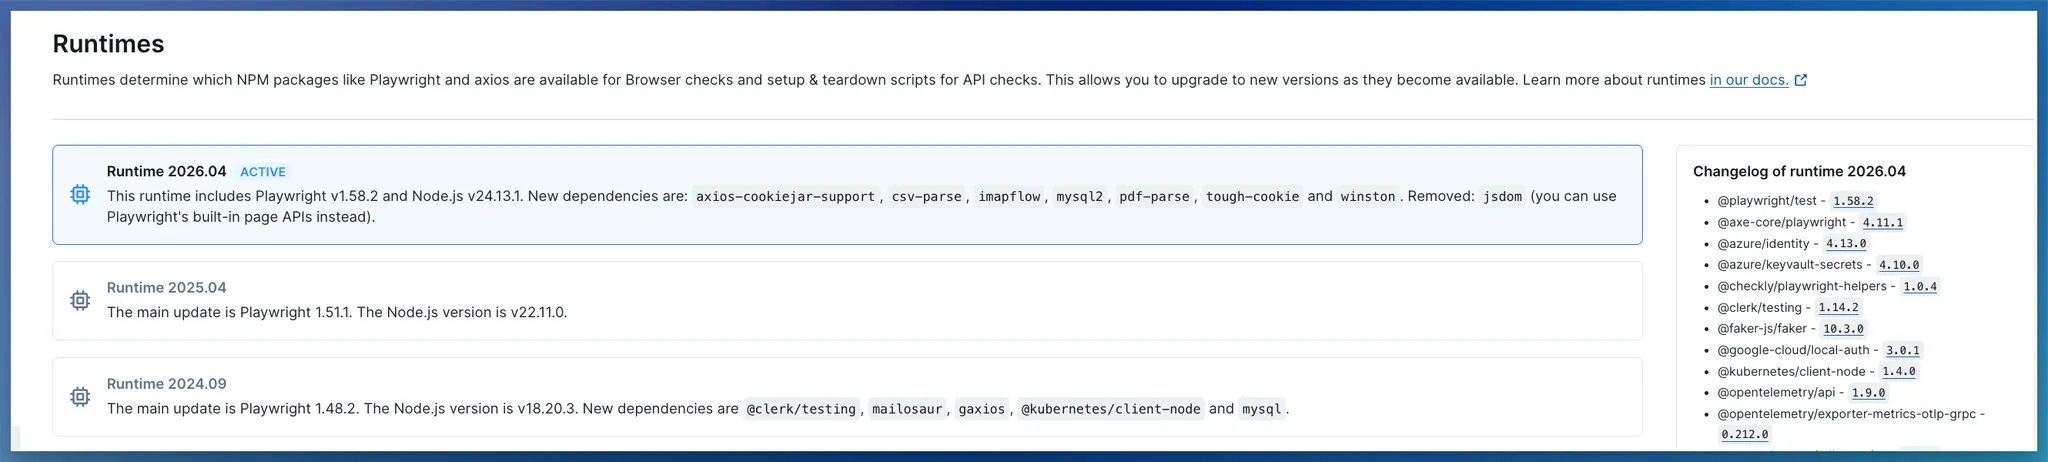
Introducing Runtime 2026-04

Runtime 2026-04 is now available for Browser and Multistep Checks. It includes upgraded Node.js and Playwright versions, along with updated built-in dependencies.

You can upgrade to this runtime from your account settings.

For private locations, support starts with image v7.0.0.

👉🏼 Lean more in the changelog update: Runtime 2026-04 is here

Playwright Check Suites

Bun support (CLI 7.11.0+)

Playwright Check Suites now support Bun as a package manager.

Improvements to custom dependency runtimes

Checkly uses your package.json and lockfile to install the dependencies your Playwright tests need to run in Playwright Check Suites.

  • Custom package manager versions: Define them in your package.json, down to the patch version. Checkly caches resolved dependencies and reuses them on subsequent runs

  • Better install logs: All four package managers (npm, pnpm, yarn, and bun) now show detailed logs for both failed and successful dependency installs

  • Cache uploads on successful runs only: After a check run passes, the dependencies cache is uploaded, creating a custom runtime for subsequent runs

  • Automatic cache invalidation: Caches are invalidated when your package.json or lockfile changes for Playwright Check Suites managed via CLI, Terraform, or Pulumi

  • Manual cache refresh: The dependencies cache can be refreshed via the UI or CLI using npx checkly test --record --refresh-cache

Checkly’s Playwright Reporter

  • Error groups across runs: Error groups now include suite runs from the Reporter, giving you AI-powered visibility across different npx playwright test runs. Requires Checkly Reporter 1.10+

  • Fix: Large payload support: Running into size limits? Reach out - we’d like to understand your use case

Developer Experience

  • Support for uptime monitors on Private Locations: DNS and ICMP are now supported alongside other monitor types, starting with v7.0.0

  • Private Location uptime image: The new uptime image (checkly/agent-uptime:X.Y.Z) is a lightweight option for running uptime monitors (URL, DNS, TCP, ICMP, Heartbeat) in Private Locations.

  • Add context to checks with descriptions: Use check descriptions to add context to a monitor, such as runbooks or notes on team and service ownership. Supported by all applicable alert channels.

  • “Created by” filter in the UI: Filter checks by their creator on the reporting page. Includes account members and user API keys. Legacy API keys and service API keys are marked as “Unattributed”.

  • Single retries on Starter plans: Starter plans now include single retries for uptime monitors (URL, TCP, DNS, ICMP), helping catch intermittent failures.


Happy monitoring!

Questions or feedback? Join our Slack community.
Monthly update

What’s New in March

Here’s a roundup of the new features and improvements we shipped over the past month.

ICMP monitors join Checkly’s stack

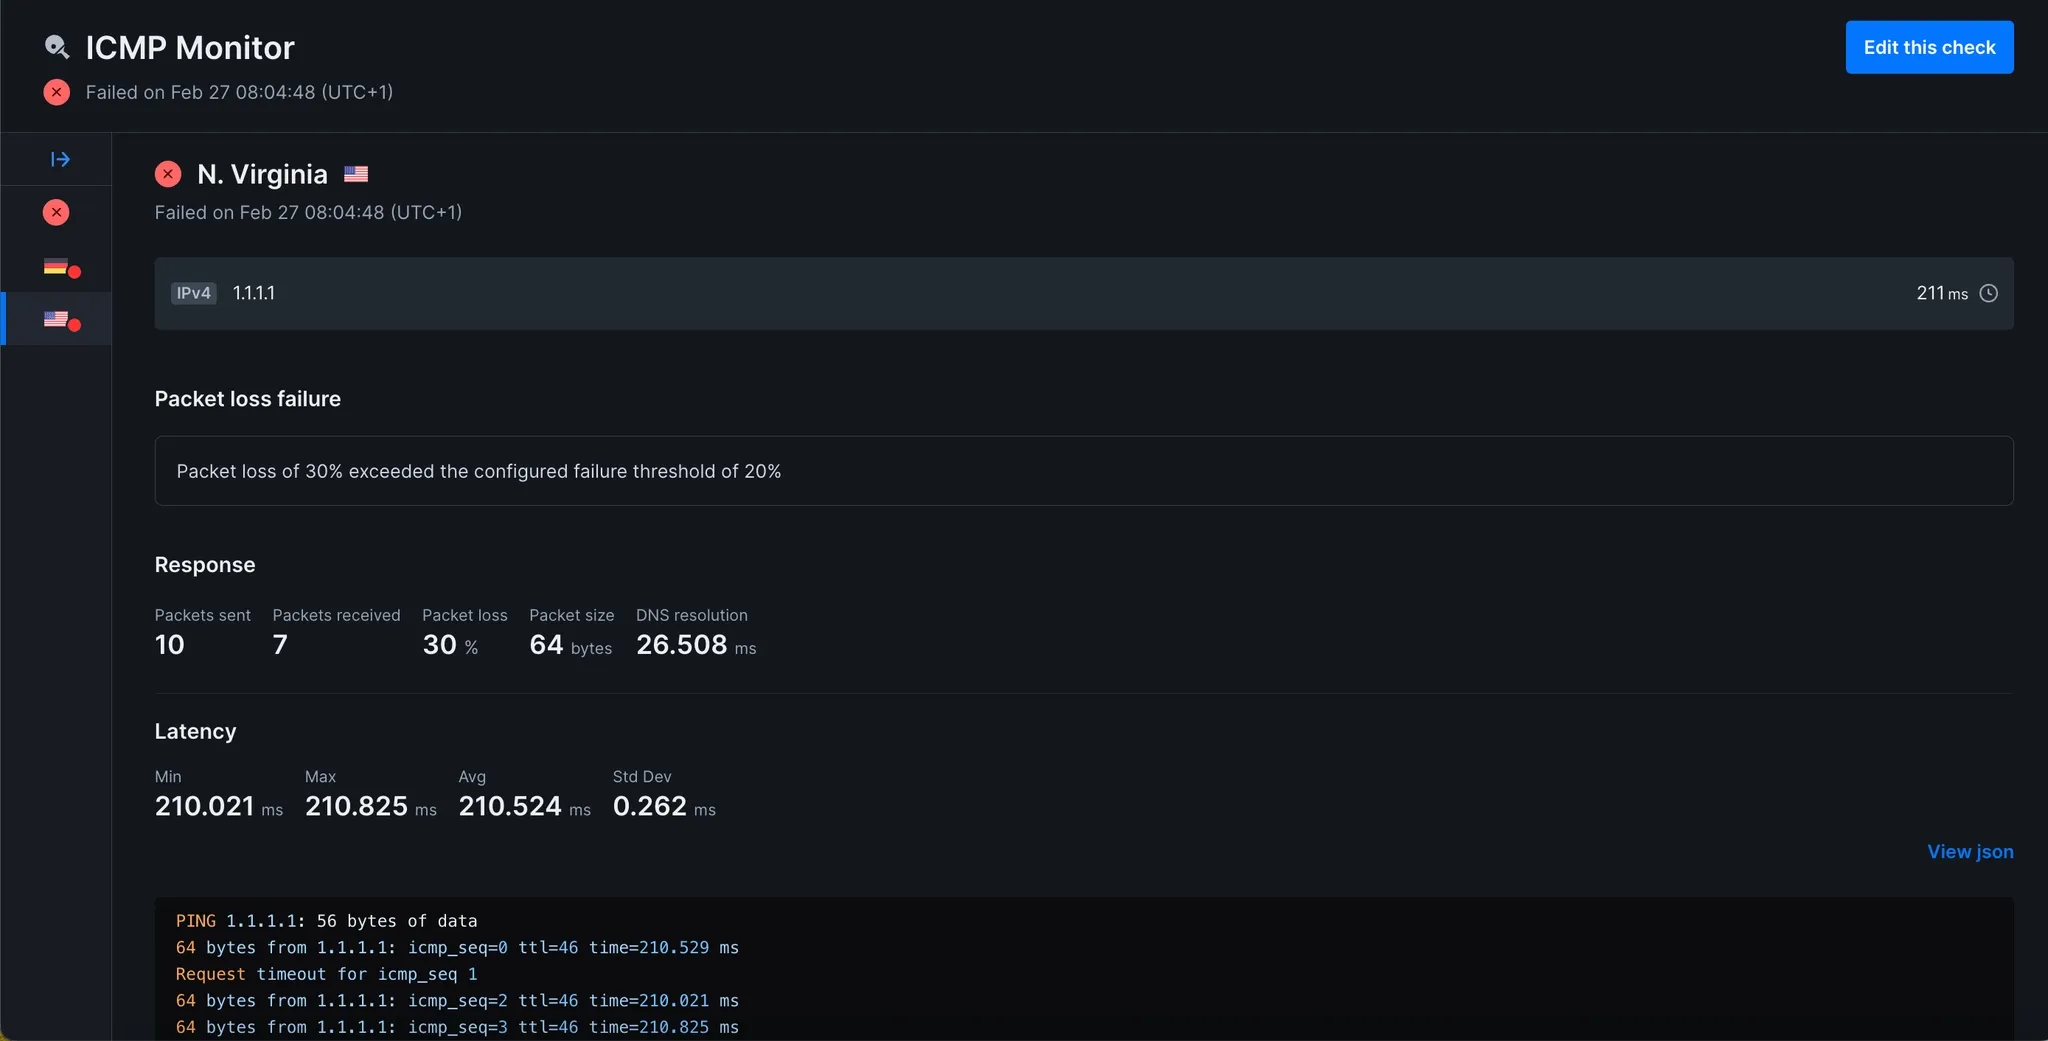
Checkly now supports ICMP monitors on all plans, allowing you to continuously ping hosts to measure reachability, latency, and packet loss across regions. This helps teams detect connectivity issues early and understand network performance before it impacts their applications.

Failing ICMP monitor example

👉🏼 Jump right in and create your first ICMP monitor, or learn more in the ICMP changelog update.

Faster incident debugging with Rocky AI

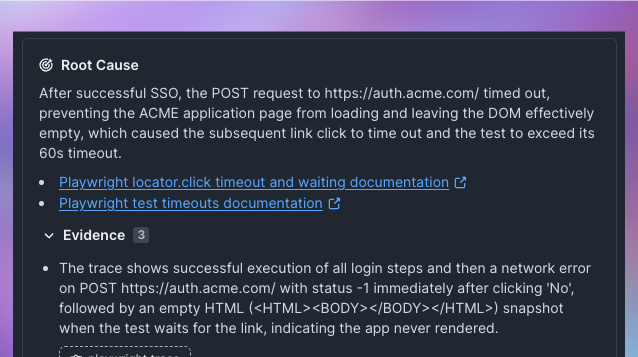
Rocky AI, Checkly’s AI agent, is now generally available on all plans. It analyzes failing checks and tests, investigates artifacts like traces and PCAP files, and surfaces the likely root cause to help teams debug faster.

Rocky AI Root Cause Analysis Example

👉🏼 Enable Rocky AI to get automated failure analysis, or learn more in the latest Rocky AI changelog update.

Playwright Reporter 1.8: A Major Upgrade

The Checkly Playwright Reporter just got a major overhaul. It now captures richer debugging data from Playwright runs (traces, logs, network activity, performance metrics, and more) making it easier to debug CI failures without digging through artifacts.

Ready to try it out? The new AI onboarding prompt makes getting started quick and easy.

👉🏼 Learn more in the latest Playwright Reporter changelog.

Developer Experience

  • Manage Status Page subscribers from the UI: You can now review and manage your Status Page subscribers directly in the Checkly Webapp and via the API.

  • Check groups v2 (simple groups without overrides) are now supported in Terraform & Pulumi: Use checkly_check_group_v2 (Terraform) or checkly.CheckGroupV2 (Pulumi). To upgrade, create a new v2 group, move your checks, and remove the old group.

  • AI-powered playwright check suites setup: The new Copy prompt button in the Playwright Check Suites onboarding lets your AI coding tool turn your existing Playwright tests into Checkly monitoring automatically. Learn more in our change log update.

  • Private location health probe endpoints: Agent v.6.3.1+ exposes HTTP health probe endpoints (/-/liveness, /-/readiness, /health) so you can configure liveness and readiness probes for your agent deployments. Learn more in our agent docs.

  • Connected agents shown for Private Locations: The UI now displays the agents connected to a Private Location, along with the agent image version.

  • Date picker on the home dashboard: Added a date picker to the home dashboard to adjust availability, average, and p95 response time metrics.

  • Region hosting info in the UI: Monitoring regions now show where they are hosted when creating checks, viewing results, and in test sessions. See our location docs for more details.

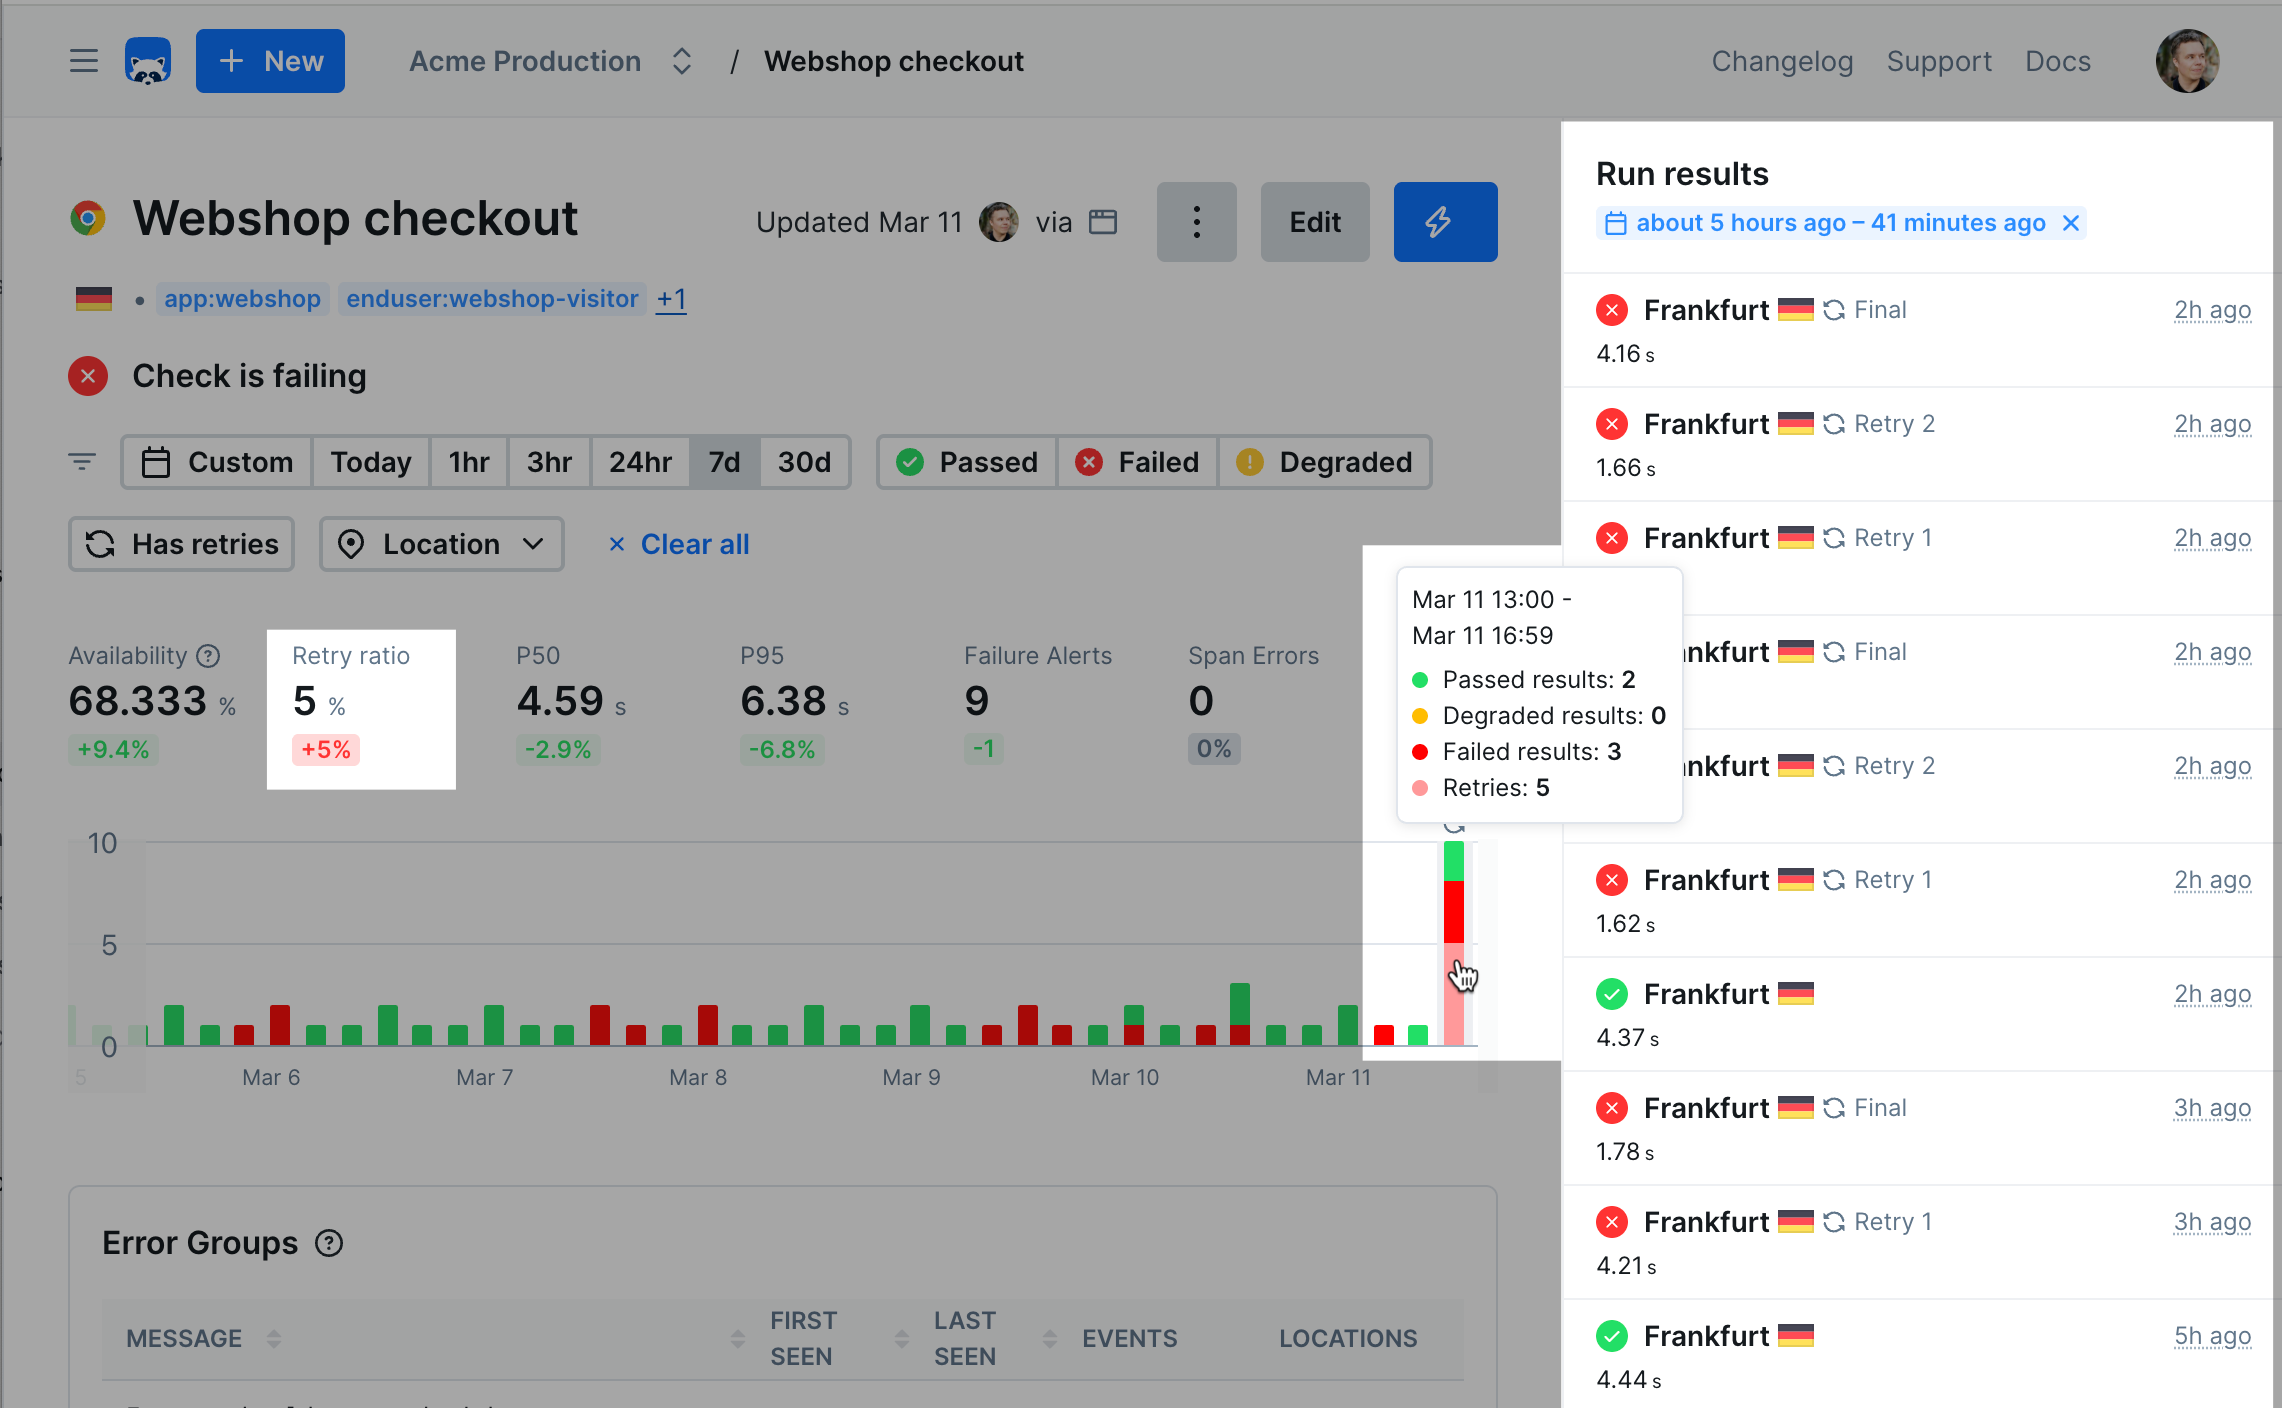
  • Improved retry visibility in check overview: Retry counts are now shown more clearly in the overview chart, results tooltip, and results sidebar.

Check overview page highlighting retries

Happy monitoring!

Questions or feedback? Join our Slack community.

Monthly update

Earlier updates